A Map to Mastery: How Agentic AI Personalizes Learning

By
Dr. Rakshith Subramanyam
Students don't fail because they can't learn.
They fail because the system doesn't understand how they learn.
For decades, higher education has treated learning as a one‑size‑fits‑all process. Courses are delivered the same way to every student, even though students absorb knowledge differently.
A Journey Without a Map
Imagine you are a freshman enrolled in an algebra course. You want to succeed. You study hard and believe you understand the material.
But when the exam arrives, something goes wrong.
Maybe certain concepts never quite clicked. Maybe solving complex equations creates anxiety. Maybe the way the subject is taught simply doesn't match how you process information.
The problem isn't your ability to learn algebra. The problem is that no one mapped the territory for you — identified the specific concepts you hadn't mastered, traced the prerequisite gaps holding you back, and adjusted the path accordingly.
Today's educational tools can tell you that a student scored 62% on an exam. They cannot tell you why. They track submissions, grades, and completion rates — the outcomes of learning, not the process. They measure coursework. They do not model understanding.

What Is a Knowledge Graph?
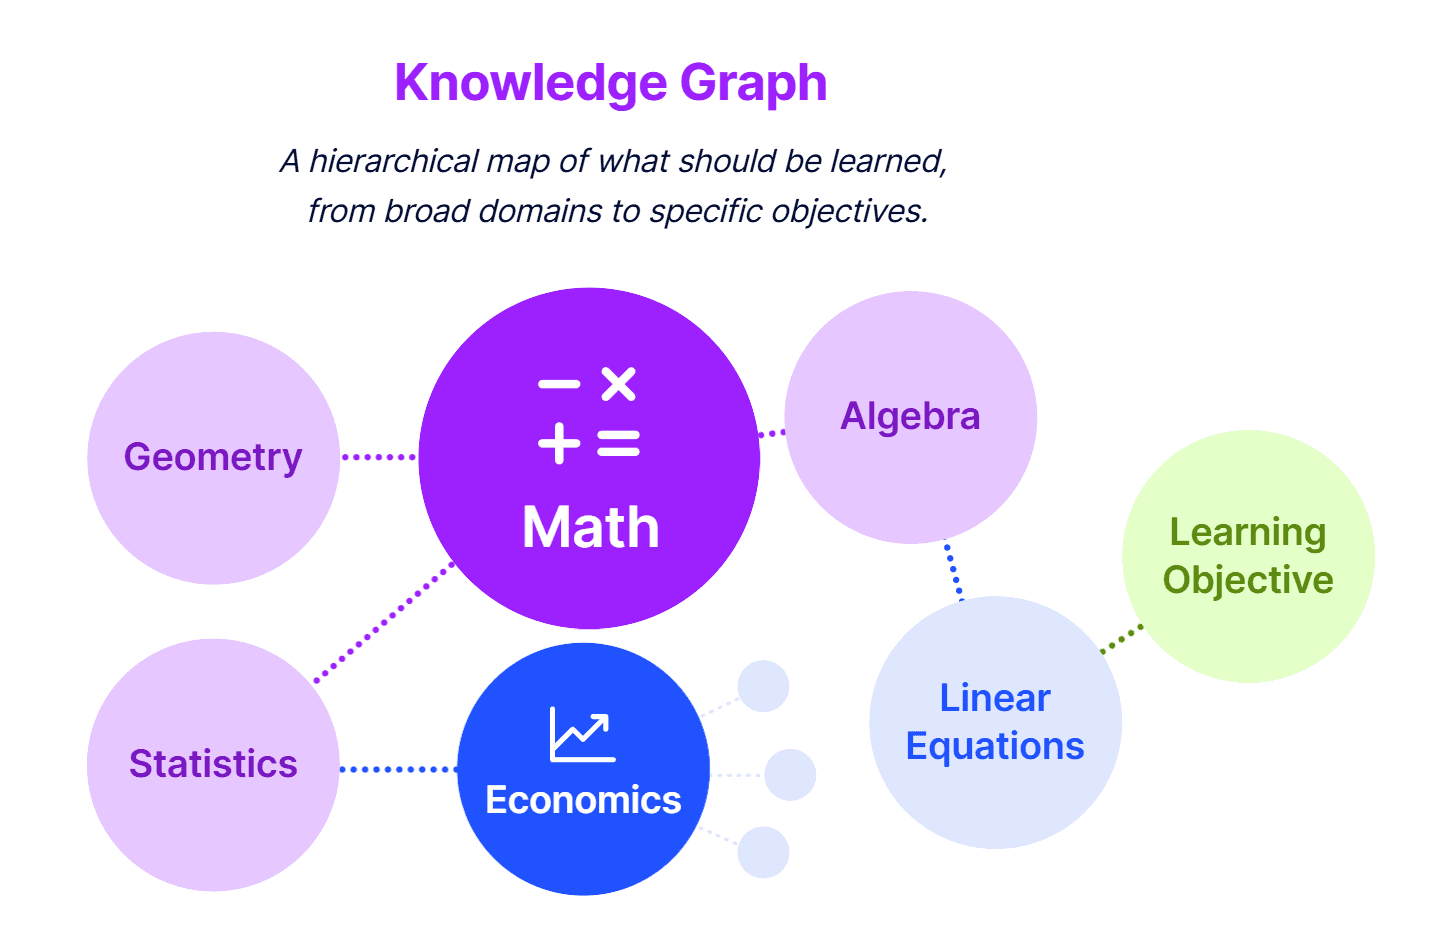
A knowledge graph is a structured map of how concepts relate to one another.
At Axio, the knowledge graph organizes academic knowledge from broad disciplines down to specific concepts — and maps the relationships between them. Every concept is connected to its prerequisites, its sibling concepts, and the skills it develops. These aren't loose tags or folder structures — they are explicit, traversable relationships.
The system knows that mastering quadratic equations depends on understanding linear equations, which depends on algebraic fundamentals. It knows that probability theory is a prerequisite for statistical inference. These relationships are encoded in the graph, not assumed.
But the graph does something even more powerful: it connects ideas across disciplines.
In a traditional course catalog, subjects are separate. Math is in one department. Physics is in another. Economics is in a third. A student taking all three might never realize that the same underlying concept connects all of them.
Consider linear algebra. In the graph, it sits under Mathematics — but it's also a prerequisite for machine learning in Computer Science, quantum mechanics in Physics, and econometrics in Economics. A single concept node links to chapters in entirely different fields. Knowledge doesn't live in silos, and the graph reflects that.
The graph also grows continuously. As new courses are created and new topics are introduced, AI maps them into the existing structure — identifying where they fit, what they connect to, and what prerequisites they carry. The map of knowledge expands with every course built on the platform.
A knowledge graph doesn't just organize content. It encodes the structure of understanding itself — what depends on what, what leads to what, and where ideas connect across disciplines.
The Learner Graph: A Personal Map of Mastery
The knowledge graph represents the territory. But every student navigates that territory differently.
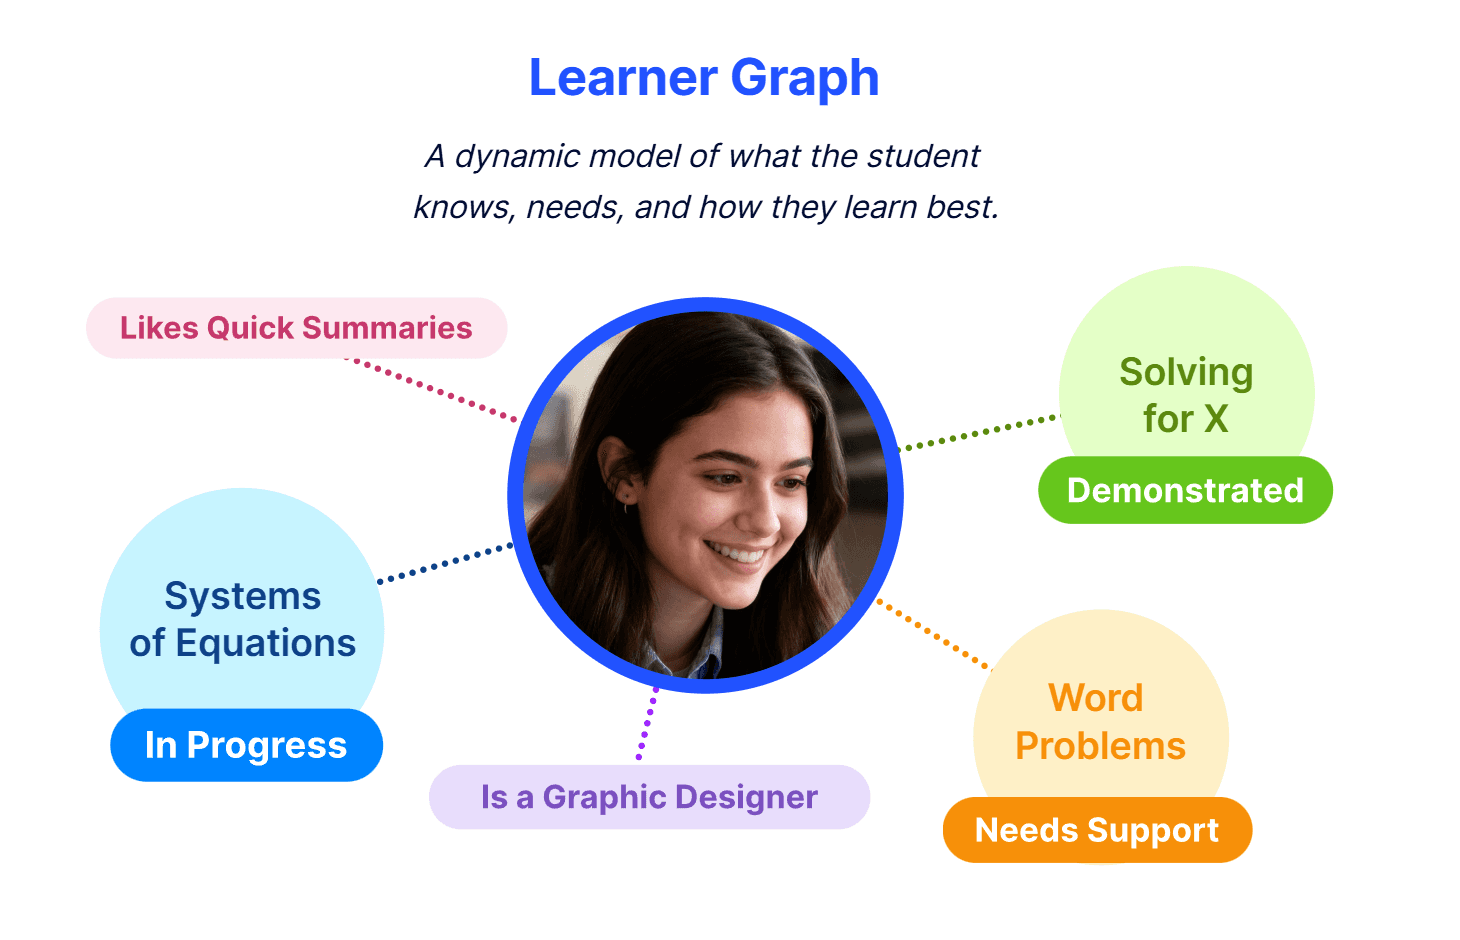
That's where the learner graph comes in — an evolving representation of each student's demonstrated mastery across every node in the knowledge graph. As a student works through a learning experience, the system evaluates their understanding at the concept level and updates mastery scores in real time.
The algebra student struggling with quadratic equations? The learner graph might reveal that their issue isn't quadratics at all — it's incomplete mastery of factoring, two levels back in the prerequisite chain. A gradebook would show a failing quiz score. The learner graph shows where understanding broke down.
And because of cross-connections, the learner graph shows something a transcript never could: how mastery in one course accelerates readiness for another. A student who excels at statistical reasoning in a psychology research methods course is simultaneously building prerequisites for data science, epidemiology, and market research — and the system knows it.
Prerequisite gaps surface automatically. The system traces back through the graph to find exactly where understanding broke down — even if the gap is in a different subject entirely.
Teaching adapts to the individual. If a student's mastery improves faster with visual explanations than procedural ones, instruction adjusts accordingly.
Progress is measured in understanding, not completion. A student who has genuinely mastered 60% of a topic is in a different position than one who has clicked through 60% of the content.
From Individual Mastery to Institutional Insight
Because the knowledge graph spans the full breadth of academic disciplines — and because cross-connections link concepts across fields — mastery patterns are visible across a student's entire academic journey, not siloed within individual course gradebooks.
A student who consistently demonstrates strong mastery in mathematical reasoning may naturally gravitate toward physics or engineering. Another whose learner graph reveals strength in analytical and narrative skills may thrive in history, policy, or communications. The graph doesn't just suggest these paths — it can show precisely which prerequisite concepts are already mastered and which gaps remain.
When institutions can see these patterns — not as isolated grade points, but as a connected map of demonstrated understanding — advising becomes more precise, intervention becomes earlier, and students are guided toward paths where they are most likely to succeed.
Instead of guessing where a student belongs, institutions can see where their understanding actually leads.
The Journey With a Map
Now imagine that same algebra student — but this time, the system has a map.
Before the first class, the knowledge graph has already identified the prerequisite concepts the course depends on. The learner graph shows that this student has strong arithmetic foundations but a gap in understanding variables and expressions.
Instead of starting with the same lecture as everyone else, the student gets a brief, targeted refresher on the specific concepts they're missing. When they reach quadratic equations, the system knows they learn better through visual representations and adjusts accordingly. When they demonstrate mastery, that understanding automatically unlocks readiness for topics in physics, computer science, and economics they haven't even enrolled in yet.
They don't just pass algebra. They build a foundation that compounds across their entire education.
That's the difference between navigating with a map and navigating without one.
From Data to Mastery
Higher education already collects enormous amounts of information about students. The challenge has always been turning that information into meaningful insight.
Knowledge graphs offer a structural answer. They transform fragmented performance data into a living map of learning — one that models prerequisites, reveals connections between disciplines, tracks mastery at the concept level, and surfaces patterns that span a student's entire academic career.
For students, that means they are no longer navigating their education without a map.

Rakshith Subramanyam is the VP of Product and AI Research at Axio Education.